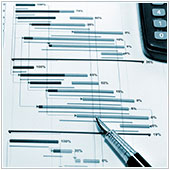
The Gantt chart was developed by Henry Gantt as a way to visualize a project’s schedule and progress. Since 1910, these bar charts have been an integral part of managing projects. Gantt charts allow us to “see” a project’s start and end date, along with each individual element or task that needs to be completed. Because many project tasks are dependent on previous tasks, Gantt charts also allow us to see these dependencies and create the schedule around them.
In order to construct a chart, you first need to list all of the required tasks in a project, along with the projected time each task should take. While you can create a chart by hand, it’s usually better to use project management software due to the level of complexity, and to allow for easy updates when those inevitable changes arrive.
Because of the relative complexity of Gantt charts, some managers question whether they are really the best solution for small businesses. Here are some of the advantages and disadvantages to using them for scheduling.
Gantt chart advantages
- Allows for efficient organization – In order for a Gantt chart to be successful, you first need to identify project elements or tasks. If you are using this type of chart you are essentially forced to focus on what truly needs to be done, with the result that you should be somewhat more organized from the get-go, and potentially see a higher overall chance of success.
- Helps establish timeframes – Because many project elements depend on other tasks, it can be tough to deduce how long one task should take and when it needs to start and be finished. Gantt charts use bars to indicate how long a task should take, giving you a better perspective of the total project and timeframe. Just be sure to consider time factors outside of the project, such as holidays.
- Highly visual – Gantt charts are visual, and give you an excellent way to instantly see and comprehend all of the different elements in one place, thus bringing thoughts and ideas together. Beyond that the visuals provide users with an easy to see chart of what needs to be done next.
Gantt chart disadvantages
- Potentially overly complex – If you’ve ever worked on a complex project, and looked at the Gantt chart, you know that these charts can be huge and hard to read. For truly big projects, businesses may need to hire specific managers to look after the details, something which could be costly for small businesses that don’t have an in-house project manager.
- Need to be updated – Gantt charts are developed early in the planning stages of a project, and there is a good chance that the project will change, meaning that the chart will need to be updated. As tasks are completed or reviewed the chart will need to be updated to reflect these changes too. Any amendments take time, especially if there are dependent tasks that need to also be revised. It is a pretty sure thing that most people involved in the project probably don’t have the time to do this
- Don’t show the whole picture – Gantt charts show what tasks need to be done and the time they should take. They don’t show how much work each task will involve, or how many people/resources each task will require. This can give some people an incomplete picture, or the wrong idea about an individual task, which can cause issues as the project gets underway.
Should I use Gantt charts?
If you are about to start a project in your organization, consider whether or not a Gantt chart is suitable. If the project is short, with few elements, then a Gantt chart might be ideal. If you have a longer project with a high number of elements and tasks, it might be a good idea to look into project management software that can help you more efficiently develop and schedule a plan .
Most of these software options will utilize a Gantt chart, but they are easier to update, edit and share with project members. Regardless of what you choose, properly planning your project is a key to its success, and Gantt charts can be a great tool in promoting efficiency.

